Revise

Stationary Points
Stationary Points
When , the function is increasing.
When , the function is decreasing.
A stationary point of a function is when it is neither increasing – i.e. when
Make sure you are happy with the following topics before continuing.


A Level Maths Predicted Papers 2025
The MME A level maths predicted papers are an excellent way to practise, using authentic exam style questions that are unique to our papers. Our examiners have studied A level maths past papers to develop predicted A level maths exam questions in an authentic exam format. The profit from every pack is reinvested into making free content on MME, which benefits millions of learners across the country.
View Product
A-A* A Level Maths Practice Papers
The MME A-A* A level maths practice papers are excellent for those top achieving students to practise for their exams, using authentic exam style questions that are unique to our practice papers. Our content experts have studied A level maths past papers and specifications to develop specific A-A* A level maths exam questions in an authentic exam style. The profit from every pack is reinvested into making free content on MME, which benefits millions of learners across the country.
View ProductFinding Stationary Points
To find a point where the gradient is , we need to set .
So, let’s say we’ve got a nice, easy function: .
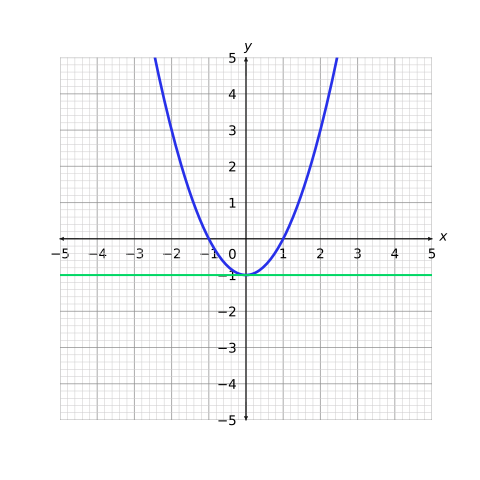
Well, we know that the gradient is given by .
Setting gives , for which .
We conclude that has a stationary point at .

Finding Stationary Points of Complicated Functions
Let for measured in radians. How might we go about finding the stationary points (in the range
)?

gives .
Setting , we require , or, .
This gives .
Therefore, for , we have the stationary points .
Finding the Nature of Stationary Points
Once we’ve found our stationary points, we need to find out whether they are a maximum, minimum, or a stationary point of inflection.
We do this by differentiating our derivative again.

So, for example, take our first example of .
We said that .
So .
Since , we can conclude that this is a minimum point. You probably figured that out from the graph, though.
What about the second example, ?
Well, we know that .
By extension, . We now need to test both of our values of for the corresponding value of .
So, for , , so it is a maximum point.
For , , so it is a minimum point.
Note
doesn’t always mean the stationary point is a point of inflection.
For example, has a minimum at , but , which equals at , so in this case leads to a minimum.
However, all points of inflection have the property , so to interpret the result you will need to check whether the second derivative changes sign either side of the stationary point.
Sketching Graphs from Information about Functions
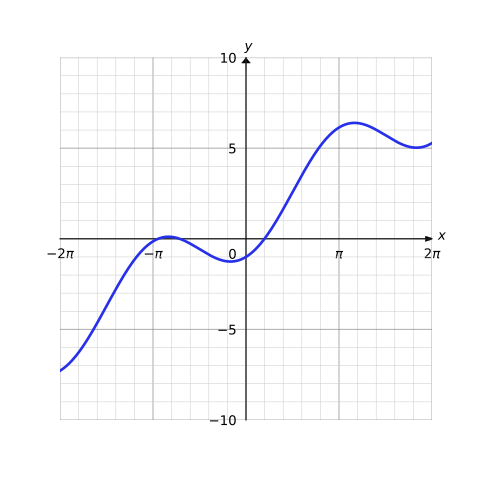
Say we have a complex function with multiple terms, i.e. where is measured in radians.
Then and .
Therefore, any stationary points will occur when , so .
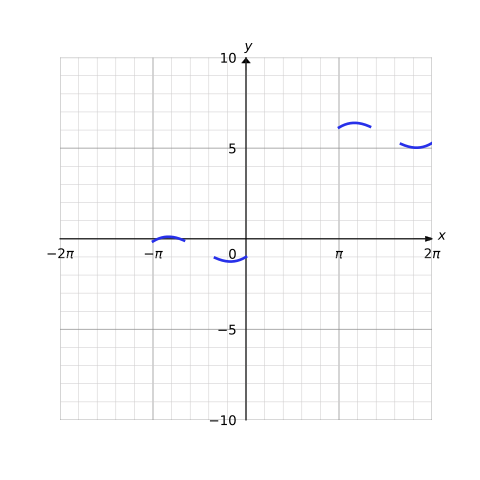
For , and , which is a maximum.
For , and , which is a minimum.
For , and , which is a maximum.
For , and , which is a minimum.
We can sketch these parts onto a graph to give us a rough form.
We can be helped further in sketching by considering the behaviour of the graph as gets really big or really small. We know that the graph roughly follows , so as gets really big so does , and as gets really small so does . With this, we can finish our graph.
Stationary Points Example Questions
Question 1: Find the stationary point of .
[3 marks]
gives
when .
Substituting this value into gives
Thus, the stationary point is at


Question 2: Determine the nature of the stationary point for the function .
[3 marks]
gives
leading to
, so this is a maximum point.
Question 3: For the function , find the -coordinates of the stationary points, and determine their nature.
[5 marks]
can be simplified to
So, has solutions at .
So
when , so this is a minimum point.
when , so this is a maximum point.
when , so this is a minimum point.
Specification Points Covered
G1 – Understand and use the derivative of as the gradient of the tangent to the graph of at a general point ; the gradient of the tangent as a limit; interpretation as a rate of change; sketching the gradient function for a given curve; second derivatives; differentiation from first principles for small positive integer powers of ; understand and use the second derivative as the rate of change of gradient; connection to convex and concave sections of curves and points of inflection
G3 – Apply differentiation to find gradients, tangents and normals, maxima and minima and stationary points, points of inflection
Stationary Points Worksheet and Example Questions

Differentiation
A Level
Calculus
A Level