Revise

Conversion Graphs
Conversion Graphs
A conversion graph is a tool that we use to convert between different units. All graphs you come across will be straight-line graphs with one unit on the -axis and the other on the -axis. You have to know how to construct and use a conversion graph given a conversion rate.
Make sure you are happy with the following topics before continuing.

Conversion Graphs Method
When using conversion graphs, we may be asked to find both ways of converting between two units. To find these conversions it helps to draw on the graph.
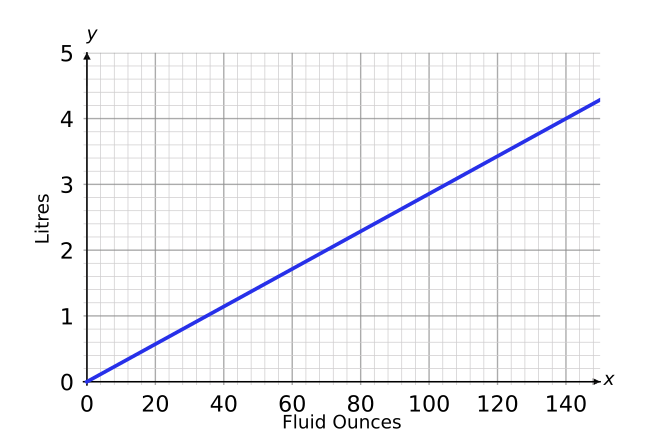
Example: Shown is a conversion graph for converting between litres and fluid ounces.
a) Convert litres into fluid ounces;
Step 1: Starting from on the -axis, draw a horizontal line until you meet the line.
Step 2: From this point, draw a vertical line down until it meets the -axis (green line).
Step 3: Read the value where your line met the -axis and you have the result of the conversion.
We can see that the litre line ends up at fluid ounces on the -axis, so litres fluid ounces.
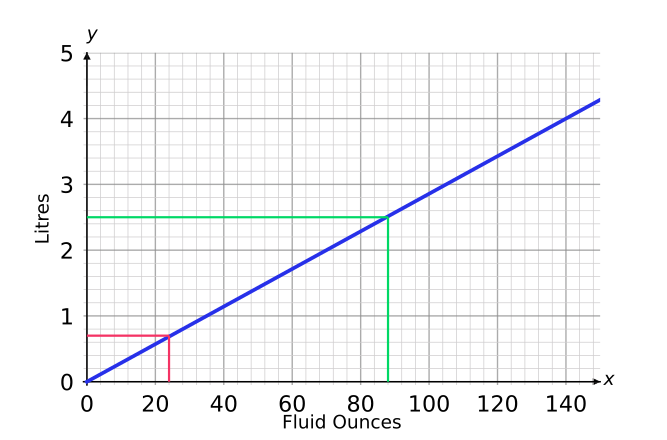
b) Convert fluid ounces into litres.
We now have to convert in the other direction, so we simply reverse the process: draw up to the graph first (the red line), then across, and this time read the result off the -axis.
We see that the fluid ounce line ends up between and on the -axis. So fluid ounces litres.
Example: Conversion Graphs

Shown is a conversion graph for converting between miles driven and the price of a hire car.
[2 marks]
a) Convert into Miles:
Drawing a line (the green line) across from on the -axis to the conversion graph (the blue line) and then down to the -axis, gives a conversion of
miles
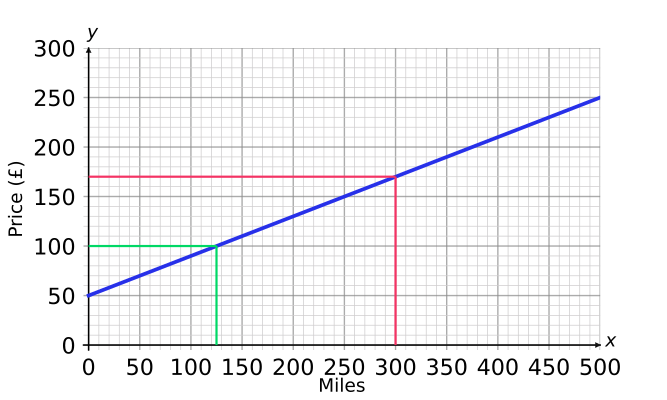
b) Miles to ‘s:
Drawing a line (the red line) up from on the -axis to the conversion graph and then across to the -axis, gives a conversion of
miles
Conversion Graphs Example Questions
Question 1: Below is a graph that can be used to convert between pints and litres. Using the graph, find an approximate value for the following conversions:
a) litres to pints
b) pints to litres
[4 marks]

a) since we are converting litres to pints, we need to locate the value on the horizontal () axis and draw a line vertically upwards until it touches the black solid line of the graph. Then we need to draw a line from this point horizontally to the left to find the corresponding value on the vertical () axis. This value falls between and pints, so the approximate answer is
litres pints
b) since we are converting pints to litres, we need to locate on the vertical () axis and draw a line horizontally to the right until it touches the blue line of the graph. Then we need to draw a line from this point vertically down to find the corresponding value on the horizontal () axis. This value falls between and litres. Since it is closer to than , the approximate answer is
pints litres



Question 2:
a) Using the conversion rate shown below, draw a conversion graph to convert inches and centimetres. The graph must be drawn in the range of to inches. (To make it easier to compare your answer to the solution, display inches on the -axis and cm on the -axis.)
b) Using your graph, convert cm to inches.
[4 marks]
a) We know that inch equals cm, so we can plot the point on the graph.
If inch equals cm, then the cm equivalent of inches can be calculated as follows:
As a result, we can now plot the point on the graph.
If inch equals cm, then the cm equivalent of inches can be calculated as follows:
As a result, we can now plot the point on the graph.
Now all we need to do is join the points, as per the graph below.
(We could have skipped one of the steps above as you only need to work out two points in order to draw a straight line, although points does ensure that you haven’t made an error. If you have plotted points and they are not in line, then one of your points has been calculated incorrectly.)

b) To use this graph to convert cm to inches, we must locate cm on the vertical () axis and draw a horizontal line to the right until it touches the line of the graph. We then draw line vertically down to find the corresponding value on the horizontal () axis. The value on the -axis is halfway between and , so
cm inches

Question 3: Using the conversion graph find approximate values for:

a) the number of litres in pints
b) the number of pints in litres
[4 marks]

a) For this first conversion, we are converting litres to pints. Since pints is on the horizontal axis, locate on this axis and go up until you touch the line. Then go across to the corresponding value on the vertical axis. We can see that this line touches between litres and litres, so we can say that
pints litres
b) For the second conversion, we are converting pints to litres. Since litres is on the vertical axis, locate on this axis and go across to the right until you touch the line. Then go down to the corresponding value on the horizontal axis. We can see that this line touches between pints and pints so we can say that
litres pints

Specification Points Covered
Ratio, proportion and rates of change – 5. divide a given quantity into two parts in a given part:part or part:whole ratio; express the division of a quantity into two parts as a ratio; apply ratio to real contexts and problems (such as those involving conversion, comparison, scaling, mixing, concentrations)
Conversion Graphs Worksheet and Example Questions

Conversions
Level 1-3GCSENewOfficial MME